|
overview
Comprehensive audio QoEThe Qualis Audio Sentinel surround sound audio monitor measures, monitors and logs loudness and virtually every other parameter necessary to ensure optimum audio reaches your viewers. The electronic equivalent of a human listener, it operates unattended, eliminating continuous aural checks by skilled listeners. This unique ability significantly reduces personnel requirements, and attendant cost, while improving the consistency of audio monitoring. Notification and loggingWhen problems are found the Sentinel can send problem specific notifications via email, contact closures or audible alarms. All measurements, alarms and logs are accessible via its network connection using a standard web browser. The Sentinel logs all measured parameters. It can be configured to preserve this data as a continuous measurement history in your long-term storage repository. Dual Stream™ loudness measurementThe Sentinel measures loudness to the latest ITU-R BS.1770, ATSC A/85 and EBU R128 standards, ensuring compliance with eventual CALM Act measurement and logging requirements. Patent-pending Dual Stream technology measures interleaved commercial and program segments – when pausing the loudness measurement on a program, it automatically performs a separate loudness measurement of the commercials. Loudness and QA Forensics™ toolboxThe Loudness and QA Forensics toolbox is a comprehensive set of tools to investigate loudness exceptions and QoE issues. Selected segments of logged data may be analyzed, compared and contrasted, all within the main user interface. Standards compliant loudness measurements may be obtained over any user selected segments. The same displays employed when measuring and reporting errors in real-time are used for logged data. Quantitative metricsUsing patent-pending technology, quantitative downmix analysis identifies stereo and mono downmix issues using objective quality criteria (such as how many dB individual mix elements may change when downmixed).This eliminates the need to monitor or interpret graphical displays, and allows automatic generation of alarms. Other parameters the Sentinel measures include channel balance, hum, channel reversal, channel interchange, dead channels and digital interface errors. AES, SDI and Dolby Digital metadata are displayed and analyzed using patent-pending technology to detect intra- and interchannel errors and inconsistencies. The Sentinel proves compliance with the CALM Act, and delivers a competitive advantage in improved viewer audio QoE. features
Monitoring basicsEvaluation of audio quality has traditionally relied on a combination of metering and listening. Both require the costly attention of trained personnel. Consequently, instruments have evolved features to reduce user involvement, including basic limit tests such as idle channel detectors and level detectors which can sound alarms. Recently, these same concepts have been applied to loudness monitoring. These simple cases aside, assessment of audio quality still requires someone with audio knowledge to interpret meter results, and recognize and address problems. What’s more, the likelihood of federal regulation has put new emphasis on the need to document what is broadcast and maintain a paper trail to defend against user complaints and potential fines. Unattended monitoringThe Qualis Audio Sentinel takes a more comprehensive approach, measuring virtually every parameter necessary to evaluate audio quality, including ones unique to surround sound and digital audio. All measurements are processed by intelligent algorithms that produce quantitative, reproducible metrics of signal quality. Significantly, this allows unattended monitoring. (It also results in meters that are easier to interpret.) You can specify limits on acceptable signal quality, and the Sentinel will let you know when there's a problem. A summary panel displays stoplight indicators (green/yellow/red) for all error conditions, and you can select which errors trigger alarms. Key to unattended monitoring is the ability to review measurements after the fact. The Sentinel logs all measurements (not just faults). You can view and analyze logged data through the same displays as live measurements, and you can also generate reports. This approach makes unattended monitoring practical, with confidence that all problems will produce alarms, alarms will be noticed, and information required for subsequent remedial action will be readily available. Connection and operationMeasurements made with the Sentinel are available for display on any web browser with network access to the instrument. (Java and Javascript are required.) In fact, you can view the displays concurrently on multiple browsers, local or remote. The display is organized as a collection of panels, each panel showing a group of related measurements. Panel positioning controls allow you to group, position within the display window, and hide or reveal the Sentinel’s display panels to suit your needs. The measurement panels consist of: channel meters, balance, spectrum & downmix compatibility, dialog balance, loudness meter, readings timeline, errors, digital interface, and dolby metadata. Channel meters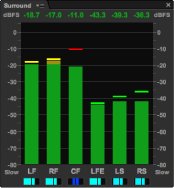
There are three channel meter panels: the surround input channels, the ancillary input channels, and the downmix channels created by the Sentinel. Scales and ballistics are user selectable. Each channel bargraph includes a numeric display which shows the true peak level of that channel. The input channel bargraphs also include indicators which show the approximate signal bandwidth for each channel. Channel balance
The Sentinel balance display shows the level balance around the sound field in an intuitive way: the fraction of program power contributed by each surround channel is computed and sets the brightness of the corresponding loudspeaker icon. For example, a program with phantom mono shows equally bright left and right front speaker icons. The arrangement of speaker icons in the balance display matches the channel layout of the surround format. If the Sentinel determines that the signal is actually stereo it will shrink the speaker icons in the unused channels. Downmix compatibilitySurround audio requires minimal out-of-phase content between channels to ensure compatibility with stereo and monaural reproduction. The important question: “will there be significant changes in levels when my audio is reproduced in stereo or mono?” The Qualis Audio Sentinel directly assesses the stereo and mono compatibility of a surround mix. It analyzes all input channels and downmixes in the frequency domain, comparing the power of each component in the original signals to its power in the downmixed signals. The numerical results of this comparison indicate the amount of signal lost by downmixing as a function of frequency. 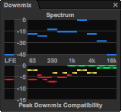
The results are summarized in the Downmix Compatibility display, grouped by octave band. If the power is lower in one or more downmixed signals there has been cancellation. The frequency at which errors occur helps identify the material affected: errors between 250Hz and 4kHz suggest dialog problems, below 250Hz generally impact special effects and those above 4kHz affect ambience. You can also define limits for these values to establish error conditions and trigger alarms. TechNote 5: Quantitative Assessment of Surround Compatibility describes in greater detail this innovative approach to downmix compatibility assessment. Spectral contentKnowledge of the octave band spectrum of the surround program is useful in assessing the importance of downmix compatibility issues. If a signal has little content at high frequencies, cancellations there will not seriously impact the sound quality of the program. It can also complement loudness measurements. The Sentinel spectrum display provides this information, summarized across all channels. To assist in monitoring individual channels, the spectral distribution for each channel is displayed below each channel’s level bargraph. The indicator’s width approximates the channel bandwidth, extending left for low frequency energy and right for high frequency. A flat spectrum input will cause the horizontal bar to extend the full width of the bargraph. Dialog will create a medium width bar biased towards the left. Loudness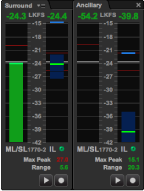
The Sentinel continuously measures, logs and displays all loudness metrics required by the latest ITU-R BS.1770, ATSC A/85 and EBU R128 standards. Continuous measurements include momentary and short-term loudness; measurements across time segments include integrated loudness, maximum momentary loudness, loudness range, and maximum true peak. Qualis Audio’s unique Dual Stream™ technology performs simultaneous loudness measurements of interleaved program and commercial content. TechNote 8: Automated Control of Loudness Measurements describes this capability in greater detail. There are two loudness meter panels, one for the surround program, the other for either the ancillary or downmix program. To aid in detecting discrepancies between surround and downmix loudness, the surround program meter displays both surround and downmix short-term loudness. Dialog BalanceDialog balance measures CF channel loudness relative to the total loudness of the other channels, gated based on the presence of CF signal. You can use it to maintain intelligibility during mixing, or to detect mixes without adequate separation. Digital and Dolby metadata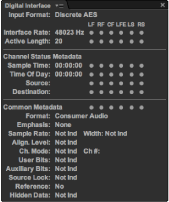
The digital input versions of the Sentinel extract metadata from the applied signals, and they measure actual sample rate, active word length and frame alignment for each of the inputs. The metadata and the measured data are displayed, checked for consistency across channels, and checked for consistency between measured values and metadata. The cross-channel and measurement-metadata checks help identify channels which don’t belong in a surround group as can happen when routing switchers are misprogrammed. The large number of channels (up to 8) in surround programs complicates the display of metadata. The Sentinel’s solution is to display one complete set of metadata at a time. The set is divided into logical groups and for each group a set of flags identifies which channels are described by that metadata. If all channels have the same metadata, all flags are illuminated and the display is static. If the metadata differs, the display cycles through the values and corresponding channel flags. If the optional Dolby decoder is present, the Dolby format is identified, and metadata as well as audio are extracted, displayed and checked. Dialnorm is compared to the value measured on the program material itself and discrepancies are identified. Errors and alarms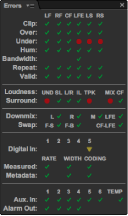
Errors relevant to individual input channels are displayed in a text overlay for each channel. Errors in channel balance appear as overlays in the balance display while stereo and mono compatibility errors are shown in the downmix compatibility display. Errors are also summarized in one display panel which includes a user selectable hold time so prior errors remain displayed for up to 30 seconds. To provide unattended monitoring of audio quality, an instrument must be able to deliver alarms when errors occur. In the Sentinel, this is a two-step process. First, you specify what constitutes an error for your application. You can specify threshold and duration limits on almost all measurements. This lets you choose an acceptable amount of tolerance, and lets you exclude transient problems of no practical importance. Second, you decide which errors trigger alarms. There are 4 alarms in the Sentinel architecture, each independently triggered by one or more error conditions, which you can select. Each alarm can generate any combination of contact closure, audible or visual indication, and email. The combination of a configurable error profile and selective alarm delivery help ensure that reported errors reflect significant problems, and that differing types of problems are routed to appropriate technical, program or management personnel. The Sentinel’s email alarm delivery is designed to avoid repeated messages. When errors occur, message generation is delayed briefly to allow clusters of errors to be combined in a single message. For persistent errors, there is a masking interval that suppresses duplicate messages for a repeated error. You can configure both the delay period and masking interval. LoggingThe Sentinel logs all measurements and errors – including levels, loudness, compatibility, metadata – at 1.4-second intervals. It logs data whether or not errors are present, so all measurements are available for retrospective analysis and reporting. The Sentinel caches over 24 hours of measurements, and can be configured to automatically transfer to a long-term data repository, providing a continuous history limited only by your retention period. Logging is closely integrated with the Sentinel’s displays. You can view the entire measurement history through the same displays as live measurements, and you can navigate through the history using an interactive timeline. The measurement history also provides an easy means to prove compliance with relevant requirements. The data is measured in accordance with industry standards and so becomes an authoritative accounting of past events. Timeline display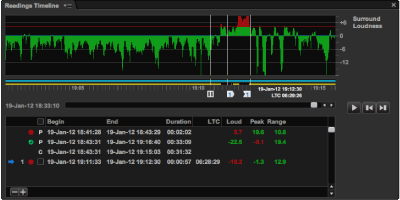
The readings timeline panel provides a summary display of the history of readings from the Sentinel. The timeline panel also allows you to identify and work with selected time segments within the readings history. The two major components of the panel are the timeline itself, which displays a set of signal traces, and the segment table. The timeline displays selected measurement traces, an error and alarm trace, and a trace that shows the time intervals for integrated loudness measurements. A current position cursors allows you to display measurements from a particular point in time, and bounds cursors allow you to isolate particular time segments for further analysis. You can select which measurement traces to display from: loudness (surround, downmix and ancillary), downmix differential, dialog balance, maximum downmix, and true peak (surround, downmix and ancillary). For each, you can choose either a compact display suitable for a quick overview, or a more detailed display with an expanded vertical axis. The traces make it easy to identify a variety of time-dependent phenomena, such as disparities between programming segments, trends over time, or error clusters. The segment table displays integrated loudness measurements for defined time segments. These include both segments recorded in real time by the Sentinel, and segments created by manipulating bounds cursors on the timeline. When you create segments using cursors, logged measurements are used to calculate integrated loudness values. This ability to determine loudness values after the fact can be a convenient alternative to real-time calculations, and offers a powerful tool for forensic analysis. Histogram display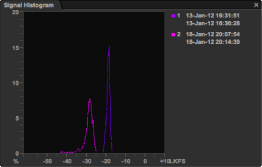
The measurements graphed during the period identified by the segment selection cursors may be displayed in a histogram. If multiple segments are selected multiple traces will appear in the histogram. This lets you examine the loudness profiles of program segments, and lets you make comparisons between segments (such as comparing the loudness a commercial to the program which carried it). Time stampsThe Sentinel incorporates a real-time clock synchronized to UTC using the Network Time Protocol, and it can connect to a facility-wide time code (LTC) signal. It displays these values and records them with logged data, allowing precise identification of events in both program position and time. Auxiliary inputsThe Sentinel includes 6 auxiliary DC inputs with a measurement range of 0 to 2.55V. It also monitors its own temperature, generally only slightly above that of the rack in which it is mounted. These values are displayed and saved in the logs. You can also define limits for these values to establish error conditions and trigger alarms. specifications

|
|||||||||||||||||||||||||||||||||||||||||||||||||||||||||||||||||||||||||||||||||||||||||||||||||||||||||||||||||||||||||||||||||||||||||||||